Follow me on Twitter @MyMoneyTrainer 6/22/2019
This post in a PDF Know Your History With Asset Class Returns
The charts in this post in a PDF MyMoneyTrainer 45 Year Asset Class Overview
Reviewing different asset classes returns over long periods of times can give you important information and a sense of where things are (potentially) in current times. Some years different asset classes all move together in one direction and other times they are all over the map. No one really knows which way any particular asset class is going to move. Many experts will try to convince you otherwise but, in the end, we are all just along for the ride with most all of this. Nevertheless, it is interesting information to review and I think important information to review for a variety of reasons.
I don’t think you should try to use the information to time movements between different asset classes at all. That said, the decision you make on how you allocate money between asset classes will likely have the largest determination of your actual returns over time. Don’t screw this up! If you were somehow able to time into and out of certain asset classes at precisely the correct times you would 1) possess a skill that only a handful of people on earth have ever developed successfully and 2) likely be a very lucky person.
This thought process mirrors the advice of the entire financial services industry. It is advice given to the masses and is wise given that the masses don’t really devote a great deal of energy to their investing. Most people are busy earning money and living their lives and their investing is ‘set it and forget it’. That is just fine. Reviewing asset class return information over long periods of times as we do suggest that this approach will likely work out just fine.
This brings me to what I believe the value in reviewing this information actually is—expectations. Of course, past performance is no indication of future results. You will hear this ‘cover their booty’ statement all the time whenever you are dealing with anyone in the financial industry who is responsible for investing. It should be a great big red flag! The people you are trusting with your investment dollars and who are likely feeing you to do this work evidently have little faith in their abilities. They are basically saying ‘we think all this makes sense but who knows and don’t blame us if we are wrong’ which is weird if you think about it. That said, past performance is likely the best indicator of what to expect in your future results over time. If an asset class has been wildly volatile in the past it will likely be wildly volatile in the future. If it has been a consistent but steady low returner in the past it will likely be that in the future. Knowing what to expect, based on a long history of past performance, is good knowledge to have in your investing life. The most important reason for knowing it is so that you can have good expectations on what you might expect in the future with your investments. If you have no clue that stocks are volatile and swing wildly up and down and then they do just that it might scare you into making a bad decision related to your asset class allocation at precisely the wrong time. Don’t do that! My childhood hero GI Joe said ‘knowing is half the battle’ and he was right!
The other thing this knowledge can help you with is to see when things are out of whack. A great example of this today is within the Cash and Cash Equivalents asset class. For almost all of history this asset class has been a low return asset class and rarely if ever had negative returns. The past decade however has produced near zero returns as the Central Banks have been using quantitative easing/stimulus to shake off the effects of the 2008 financial crisis. This is out of whack…and I think important knowledge to have because of its impact on this asset class and others.
Two other super important things to know that are highly related to all these asset class returns is 1) inflation and 2) interest rates. Looking at asset class return information without looking at these two data points is only one side of the picture.
Inflation is important to know because it provides you with what your real return is. For example, the high returns (8%+) in the Cash and Cash Equivalent asset class back in the late 70’s and early 80’s are abnormally high and better than what riskier asset classes normally often earn. But inflation during that time was also running about the same rates. So even earning an abnormally high rate of return meant you were still just treading water (and maybe even losing ground). Just looking at your bank statement might make you feel great with an abnormally high rate of return on this asset class. But when you look at it versus inflation. YIKES!
Interest rates are important to know because these rates dictate all kinds of things related to financial assets and are hugely important in determining their value and their expected long-term returns. Those high interest rates back in the late 70’s and early 80’s dropping over the following 3 decades to 5,000-year lows. That has produced an enormous bond bull market where you could earn the return of usually much riskier asset classes in the relative safety of bonds. It has led to the valuations on stocks to rise because of the low cost of capital and comparative risk-free returns used in the value of future cash flows generated by the business. Interest rates and their movement are the most important thing in what the value of (and subsequently what return you can expect) for all the asset classes. News Flash…no one knows where rates are going! That doesn’t stop people from opining on this topic and having very strong convictions on it and subsequently making big bets to match their convictions. Some get it right fairly consistently, some get it right sometimes, many get it wrong a lot, and some never get it right. Not one of them really knows what will happen with interest rates in the short term or long term.
I am an Enterprising Investor. This is a term used by Ben Graham in The Intelligent Investor that describes a person who expends more energy than the average person in order to try to beat the average person. This is me. I spend a good deal of time thinking about and researching all kinds of things related to investing in hopes that I will be able to do better over a long period of time than the normal person. I also do this because I enjoy doing it. Looking at a bunch of charts, researching companies to invest in, and reading about investing is fun for me and a way to keep the old ticker noodling on something all the time. I’m not a dummy but I also know I’m not as smart as many others out there in the investment world. What does all this asset class return, inflation, interest rate stuff mean for an Enterprising Investor like me?
Do not try this at home! Because I will probably lose all my money and be homeless because I don’t do what I’m ‘supposed to’ do. I don’t listen to the typical advice about timing markets and all that. Ain’t nobody got time for that?!?! Ha! I will frequently move money and invest new money into asset classes based on all the information I’m taking in. I will probably be wrong, and potentially really wrong. This will cause me to lose money and potentially lots of money. I might not actually lose money but I might just lose more or make less than I could normally (ie do worse on a relative basis). This is no better.
Why would I do this? The main reason is so I can sleep will at night. I have a decent temperament for investing for the long-term. I don’t sweat it too much when things don’t go the way I think they will in the short-term (or even long-term). I also never really stray too far in any direction. I generally would prefer to be 100% allocated to equities over the long-term (which is all I have invested). Equities are a great asset class to stay ahead of inflation and produce a real return (potentially the best/only asset class that does this). If I stray too far from that the reason I’m doing it is I believe things are out of whack and that other asset classes are better for me to own to 1) sleep well at night, 2) get a good value for my investing dollars, and 3) keep an inflation hedge but also some dry powder or more liquid money for if/when stocks have a drawdown/disruption.
At this time, I am about as far away from my ‘normal’ allocation as I have ever been. I’ve made most of this allocation swing since around February 2018.
My Normal Preferred Allocation:
- 100% Stocks
My Current Allocation:
- 50% Stocks
- 25% Bonds
- 25% Commodities
I’ve made this decision based in part on my review of asset class returns, inflation, and interest rates. This is no recommendation at all for anyone reading this it is just where I sit currently based on all the things I look at. It could change any day of the week (even wildly). In practice I don’t make wild changes to this allocation because I have rules (my own) that I’d have to break to make a quick change in these allocations. I have developed these rules to slow myself down and to let things play out as I’m making changes to my allocation over time. Everyone’s allocation to different asset classes is their own decision. The biggest reason my allocation is what it is today is because it allows me to sleep like a baby at night. I feel like I am positioned decently for whatever comes (higher/lower inflation, higher/lower rates, stocks going up or stocks going down). Depending on how things go I will do better or worse but I believe I have a decent allocation to not be caught on the wrong side of whatever comes. I definitely have a scenario that I believe is most likely to happen and am positioned accordingly. But if I am wrong, I won’t be sleeping under a bridge somewhere. I hope anyway! That is a really important consideration! Ha!
Just to give you an idea of how I translate all this information into my actual investment thesis / asset class allocation this is why I am allocated how I am today (and why I am not fully invested in stocks right now). Again, just information and not a recommendation:
- Stocks are overvalued on a variety of measures. I’d love to be 100% stocks (and usually am). But the entire financial system is such an unprecedented mess that I feel like I need to diversify a bit and hope something works out!?!?
- Interest rates are distorted (low), the world is in massive debt, and the yield curve just inverted. I’m not sure how all that plays out but it is a lot of risk (that I don’t think is priced into stocks at/near an all-time high).
- Commodities are cheap relative to financial assets and history. I’m holding these as a hedge against inflation and because I believe they are a better value than stocks.
- I don’t want to take any duration risk. I think rates will drop but I want money safe and sound when I want it to rotate back into stocks (regardless of what rates are doing). So, I’m in super short duration bonds and yielding just as good as longer duration bonds.
Over the years I’ve compiled information on asset class returns, inflation and interest rates for my own review. I’ve tried to compile it into easy formats for me to review. I’ve included the information here along with some completely unnecessary commentary of things I find weird. I hope you find at least some of it helpful! Enjoy!
All Asset Classes

I find this chart very interesting as it overlays each asset classes returns on top of each other (it doesn’t stack them). This is valuable because it shows you sentiment of all asset classes in a particular year. For example, in 2008 pretty much every single asset class was negative (and deeply so).
This chart overlays (not stacks) all asset class returns of the past 45 years on top of each other (also with a top/bottom view). #inflation #cash #bonds #stocks #realestate #commodities
Inflation

This chart shows inflation over the past 45 years. #inflation
Interest Rates

This chart shows the 3 Month T Bill return (risk free rate) over the past 45 years. #interestrates
Cash

This chart shows the Cash and Cash Equivalents asset class over the past 45 years. #cash
Bonds

This chart shows the Bonds / Fixed Income asset class over the past 45 years. #bonds $AGG $BND $SHV $VCIT $VCSH
US Stocks
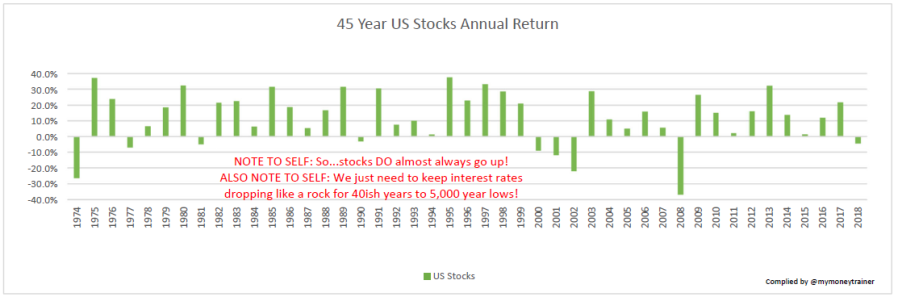
This chart shows the US Stocks asset class over the past 45 years. #stocks $SPY #SPX $IVV $VOO $QQQ $IJH $VTV $IWF $IJR $IWM $VUG
International Stocks

This chart shows the International Stocks asset class over the past 45 years. #stocks $VTI $VEA $IEFA $VWO $EFA $IEMG
Real Estate / REITS

This chart shows the Real Estate / REITs asset class over the past 45 years. #realestate #REITs $VNQ $SCHH $IYR $XLRE $RWR $ICF $USRT $REM $FREL
Commodities

This chart shows the Commodities asset class over the past 45 years. #commodities $PDBC $DBC $GSG $DJP $GLD $IAU $SLV $USO $RJI
45 Year Asset Class Overview
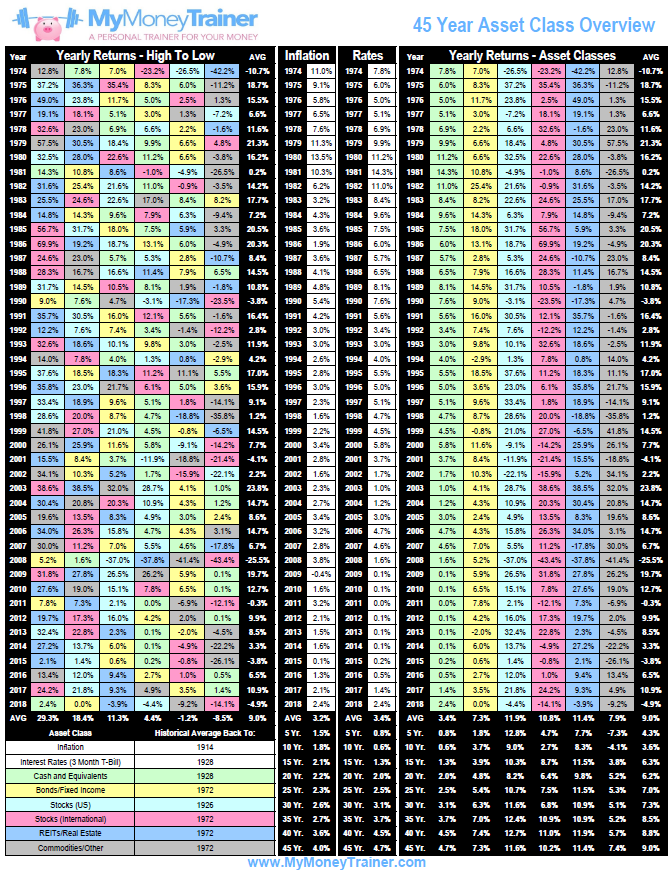
This chart shows our 45 Year Asset Class Review. It is a lot of information crammed onto one page. #inflation #cash #bonds #stocks #realestate #commodities
